Features
Insights: once a week, what was asked most and what went unanswered
The numbers come from the database and the sentences from the model. The model invents no number, and every claim is one click from its conversations.
The problem
A dashboard that says "40% satisfaction" does not say what to do. A sentence that says "12 people asked about sheet music and 7 conversations went unanswered" does.
- 01
The weekly report
A few concrete sentences from the week's conversations: the most-asked questions, what went unanswered, suggested tags. Under 20 conversations a week, no report is written; a pattern in thin data is an accident.
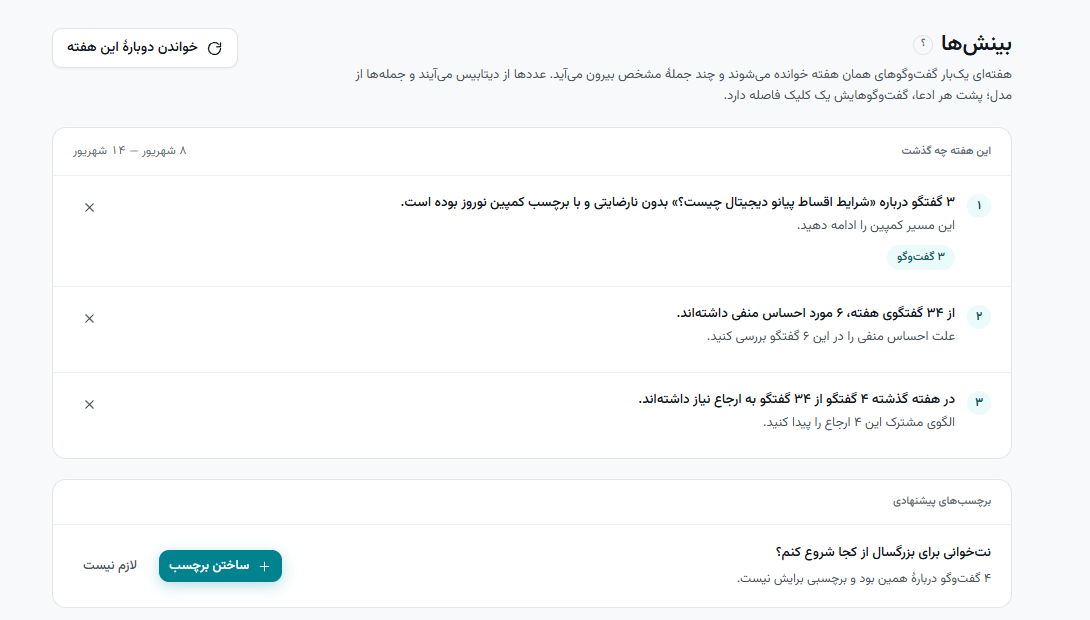
The weekly report, suggested tags and the answers the agent was unsure about. - 02
The answers it was unsure about
A list of answers where the agent's own confidence was low. If it is long, raise the hand-off floor or add the knowledge that is missing.
- 03
Gaps become a content list
Every question the knowledge could not answer is a row with its count. For marketing, that is the content backlog; for support, today's to-do list.
- 04
Analytics
The numbers: resolved, satisfaction, handled, over time. Whether the agent actually helps, and where it still needs you.
Typical chatbot
Charts you have to interpret yourself.
goya24
Sentences with real numbers and links to the conversations behind them.
The rest of the product
Your first agent is ten minutes away
Free while you evaluate. Bring your own model keys if you'd rather.